

Automated Performance Testing of Desktop Applications
For the most part, performance testing is associated with Web applications. This area is more or less covered by a lot of articles and videos about how to use JMeter and other tools, which allow load generation and performance metrics capturing. Here’s a detailed guideline to testing the performance of Windows desktop applications.
But how do you test the performance of a Desktop application? Long story short, here are some basic requirements:
- No sources of application (black box)
- Any Windows application (usually these are resource intensive applications such as arhivators, backup utilities, etc.)
- Different operations with the application under test and system performance tracking (RAM, CPU, and other metrics)
- Notification about the system state when the user performs any action (for example, button clicks, message box pop-out (GUI events), etc.)
To show how everything works, here is one of the possible approaches to test the performance of Desktop applications.
Tool Selection
UI testing tool
In order to capture performance data during user actions, we need to handle the application under test and interact with it, in particular click on controls, emulate mouse and keyboards events, etc. The selected tool should satisfy the following requirements:
- Interact with any Desktop application: Java, .NET, native Windows app, and others
- Emulate user actions, clicks, keyboard/mouse events
- Recognize controls by text/image (language and technology agnostic approach)
- Capture performance information of actions: when control becomes available, etc.
After a short investigation, I have found two possible tools: Sikuli and Al’exa. Both are open source projects, with more detailed features description and comparison to be found here. As it’s capable of grabbing performance data and integrating with the Nagios monitoring system, Al’exa was selected as the main tool for UI performance testing.
Resource monitoring tool
To analyze metrics like CPU/RAM usage, I/O HDD operations, etc., a resource-monitoring tool is needed. Basically, Al’exa supports integration with Nagios, an open source resource monitoring tool which can be installed on Linux based OS. I have tried it on Ubuntu and found installation/configuration and usage very cumbersome, since it requires installation of NSClient++ on the client side, along with SQL/PHP/WebServer and other packages on the server side. I needed to get results faster and simplify monit oring tool configuration and deployment, so I used Windows Performance Monitor and integrated it with Al’exa.
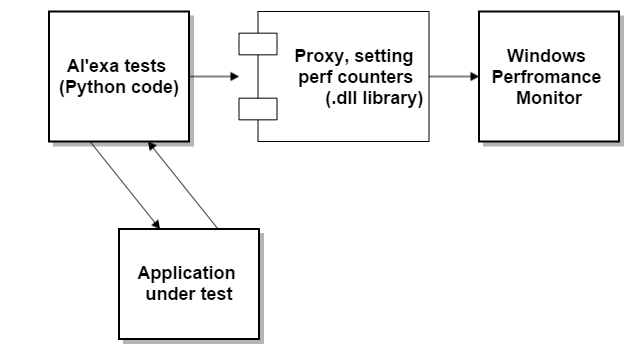
Integration of UI and resource monitoring tools
Windows Performance Monitor (WPM) allows custom counters to be created and set through a proxy which will send performance data from Al’exa to WPM.
Solution Implementation
This section dwells upon implementation of a solution for Desktop Performance Testing by choosing a specific Desktop Application and trying to retrieve metrics.
I opted for an installed 7-zip activator that can generate a number of system resources (benchmarking feature). Here’s a simple test case for 7-zip:
- Start 7-zip File manager
- Click Tools
- Click Benchmark
- Wait for 5 seconds
- Press Stop
- Close the window
The system metrics are measured within the following operations order:
- Navigate menu and open benchmark window
- Perform benchmarking for 10 seconds
- Stop benchmarking
Results Analysis
After script execution, we obtained the following results:
- CPU consumption started increasing after we clicked the Benchmark button and dropped down only after we stopped it (blue line).
- Before we started the test, there was above 3Gb of available memory and after the test it dropped to 2.5Gb
- During Benchmarking, the highest load of CPU was 87% and just before the stop it had increased to 100%.
In the full version, you will find additional information:
- How to record performanc e data to file
- How to configure environment and download script/libs
- References to Performance Monitor manual and getting started info
Summary
Performance Windows Monitor enables tracking of all the important metrics and system/process parameters. In addition, it can capture performance metrics to CSV, log, binary, tabulated files, or SQL. Also WPM provides the opportunity to schedule monitoring execution, define stop conditions, execute all types of actions on specific conditions, etc.
The combination of Al’exa and WPM results in a powerful flexible test and monitoring system for Windows desktop applications. When tracking applications from different hosts, opt for integration with Nagios or other monitoring systems. Scripts and code provided in this article were created as a proof of concept and can be improved and applied according to your needs.