

Boost Oil Production by Optimizing Operating Parameters of an ESP With AI. Phase Two
In 2021, Vital Energy partnered with SoftServe to prove the feasibility and validate the business value of an ML-based optimization solution for ESP wells. The primary objective was to maximize well life and increase production rates by optimizing ESP systems. We created a proof of concept (PoC) phase that included the ML model trained on small data samples and dashboard prototyping. Check out this POC case study here.
After the project’s first phase, we moved to the pilot phase to extend the existing functionality and unveil a completed model that can be applied to all wells currently in operation.

Business challenge
During the PoC phase, we established relationships in well controls and identified optimization opportunities. Our focus during the PoC was on optimizing ESPs that had been running at a stable frequency for a while and were not showing signs of gas locking, critical scale buildup, or pump malfunctioning. By addressing these optimization opportunities, we demonstrated the potential for even greater improvements in efficiency and performance and proved the technology's ability to safely boost production.
After the PoC, development efforts were focused on scaling the solution to all wells running on ESPs. A top priority was creating effective approaches for anomaly detection, such as gas interference at an early stage, scale buildup, near-fracking activities, and many others. To achieve this, multiple machine learning (ML) models and dashboards were created. Anomaly detection ML models were incorporated into an equipment health and data monitoring system, along with a developed data quality monitoring system. Additional data annotation and interpretation solutions were presented to help capture subject matter experts' knowledge and incorporate it into the ML models.
As a result, the ESP optimization solution is now enhanced with additional models and dashboards, making it more valuable and creating a highly scalable solution that can work under different circumstances and configurations.
The approach
The SoftServe and Vital Energy teams collaborated on ESP well production optimization, focusing on an ML model designed for accurate production forecasting. The model takes ESP telemetry data and well production rates for the days before prediction and predicts well production for the following day with given ESP control parameters. In addition, the ML model predicts ESP telemetry for the next day. This approach allows the client to not only predict water, gas, and oil outcomes for different control parameters to find the most optimal ones but also describe the approximate state of the system (temperatures, pressures, power consumption, etc.).
Conceptually, the solution consists of two parts:
- Automated python scripts that run with AWS step functions
- The dashboards visualizing the results
The SoftServe team developed the data processing and visualization parts, a set of automated python scripts and dashboards with well production optimizations and model forecasts analysis. The dashboards allow users to interact with the developers and the model itself with optimization feedback and telemetry constraint forms.
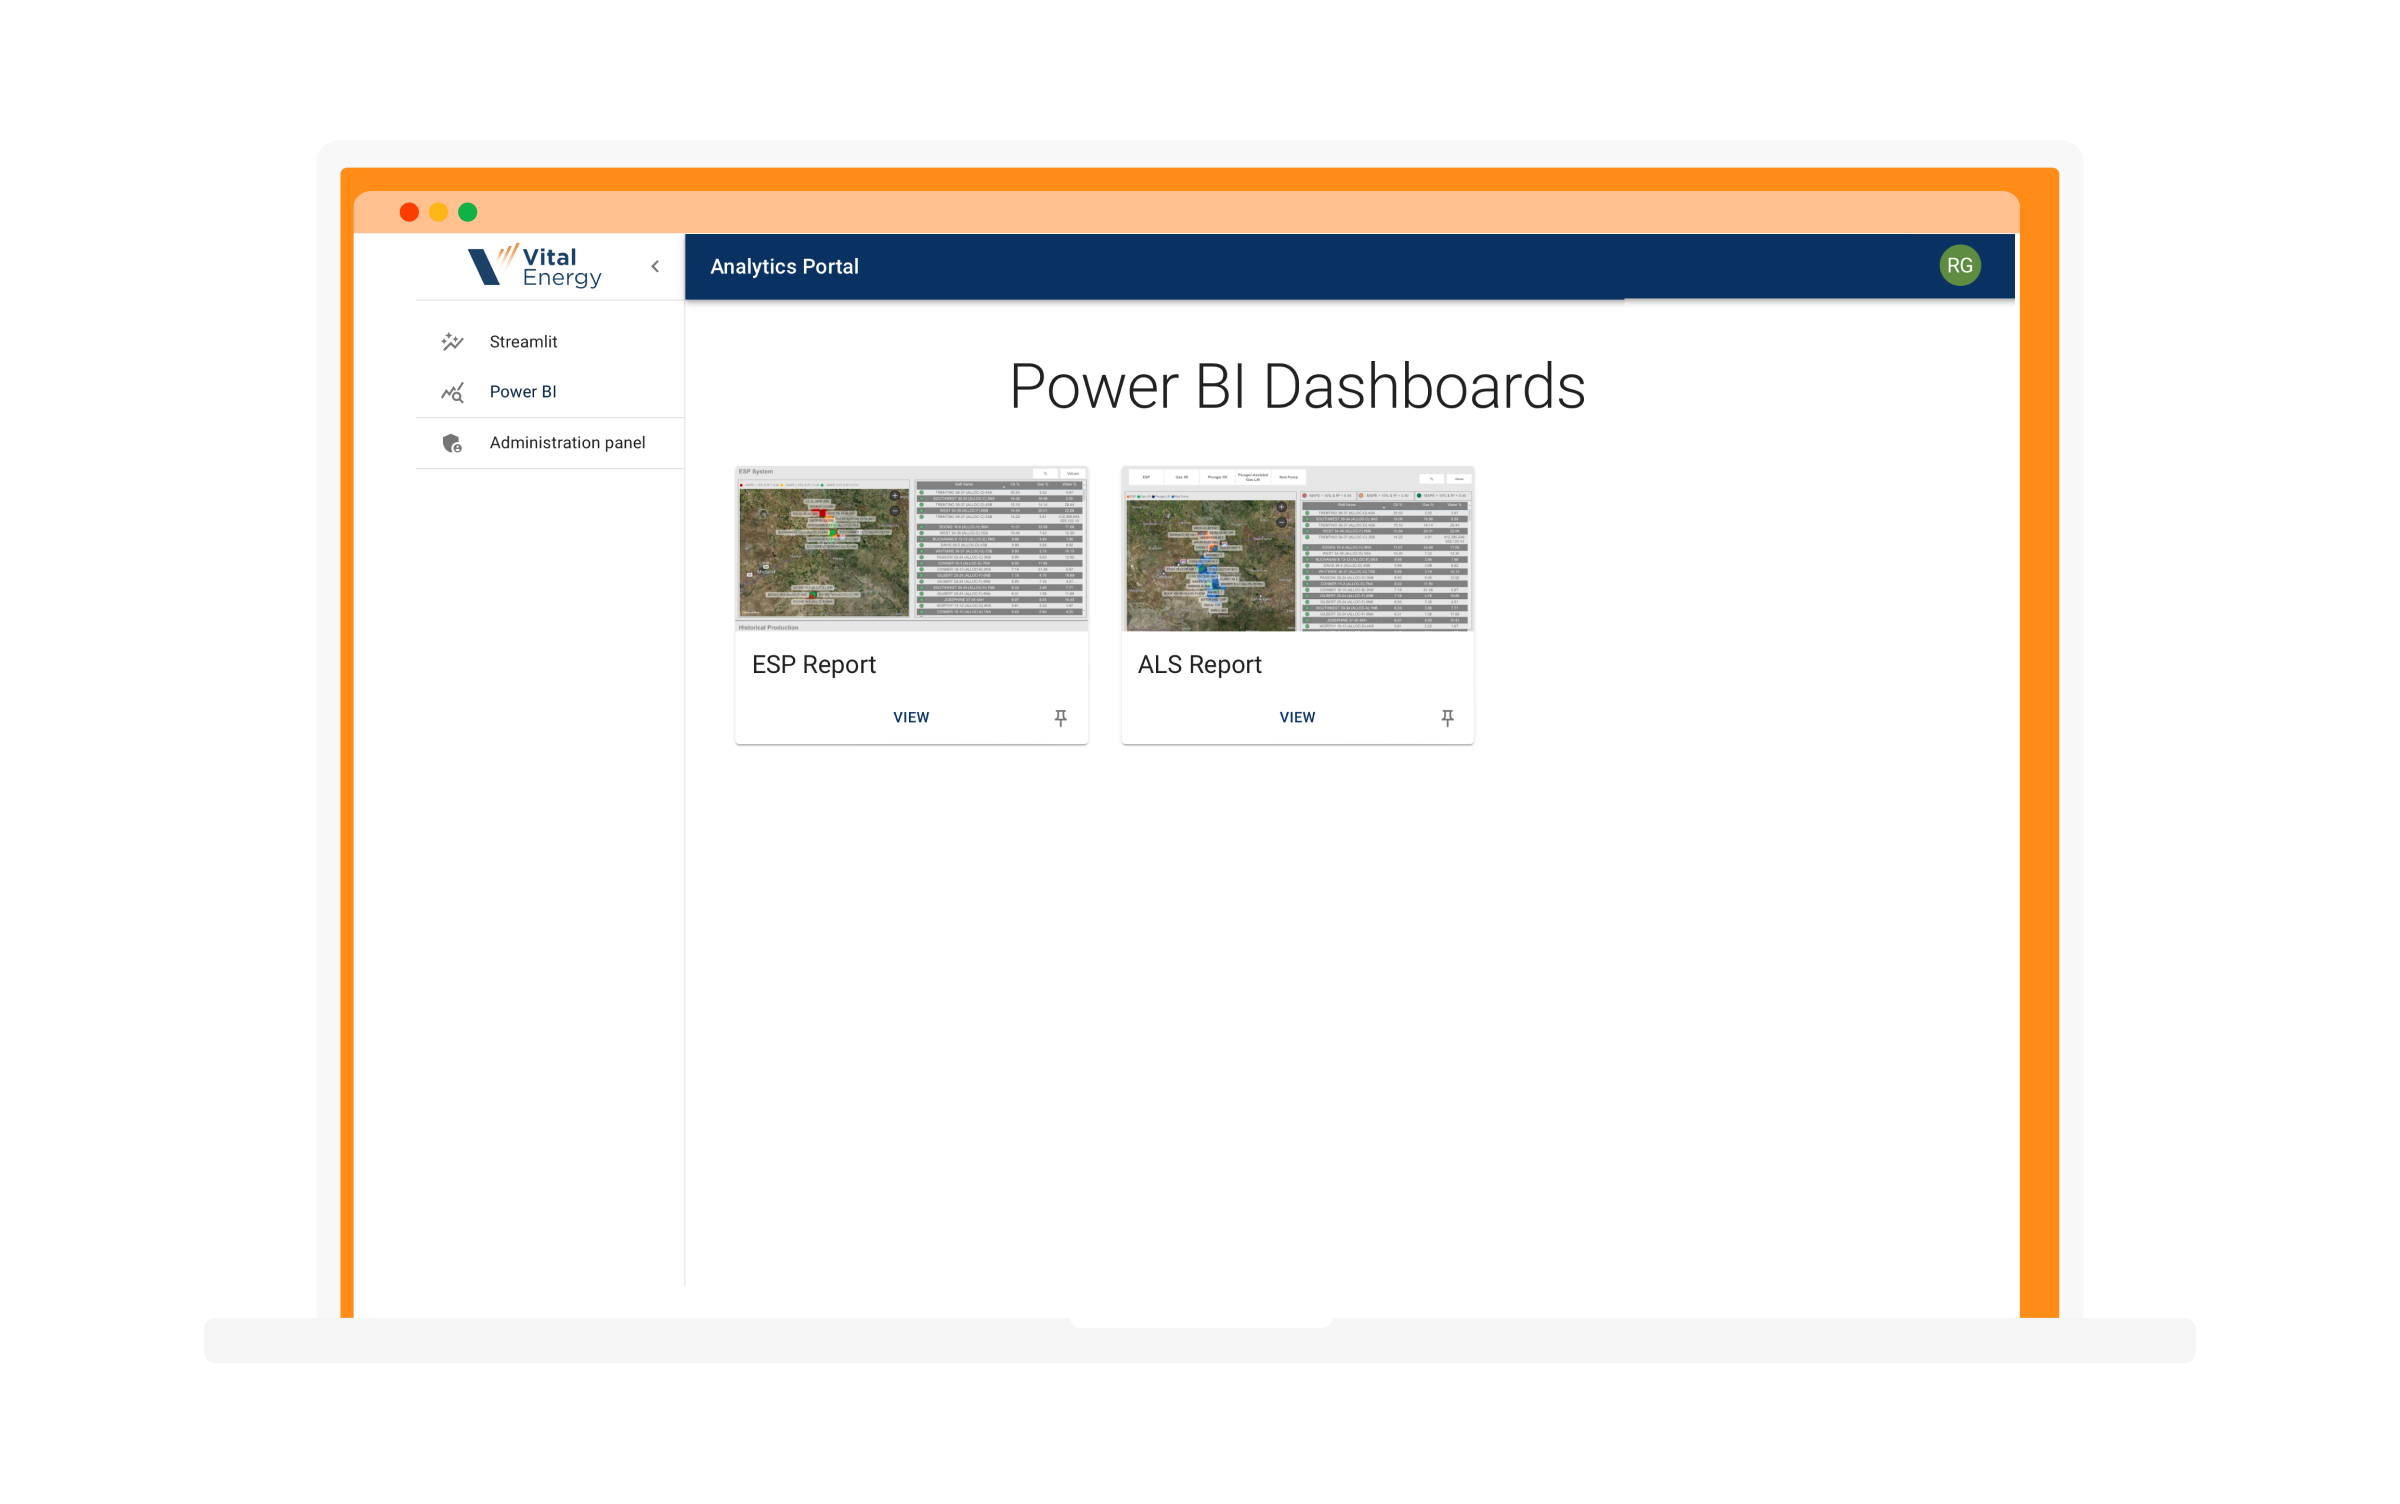
With the introduction of the analytics portal, all existing and new dashboards are available in one place. Access to the data and insights, cooperation, and solution adoptions are even more straightforward. Dashboard access is restricted based on the user’s role. Users, user groups, and dashboard cards can be managed from the admin panel. The analytics portal is easily accessible from any type of device: mobile, tablet, and desktop. It also allows for the quick deployment of new dashboards to production, making it possible to test new machine learning models and routines right after the prototyping phase.
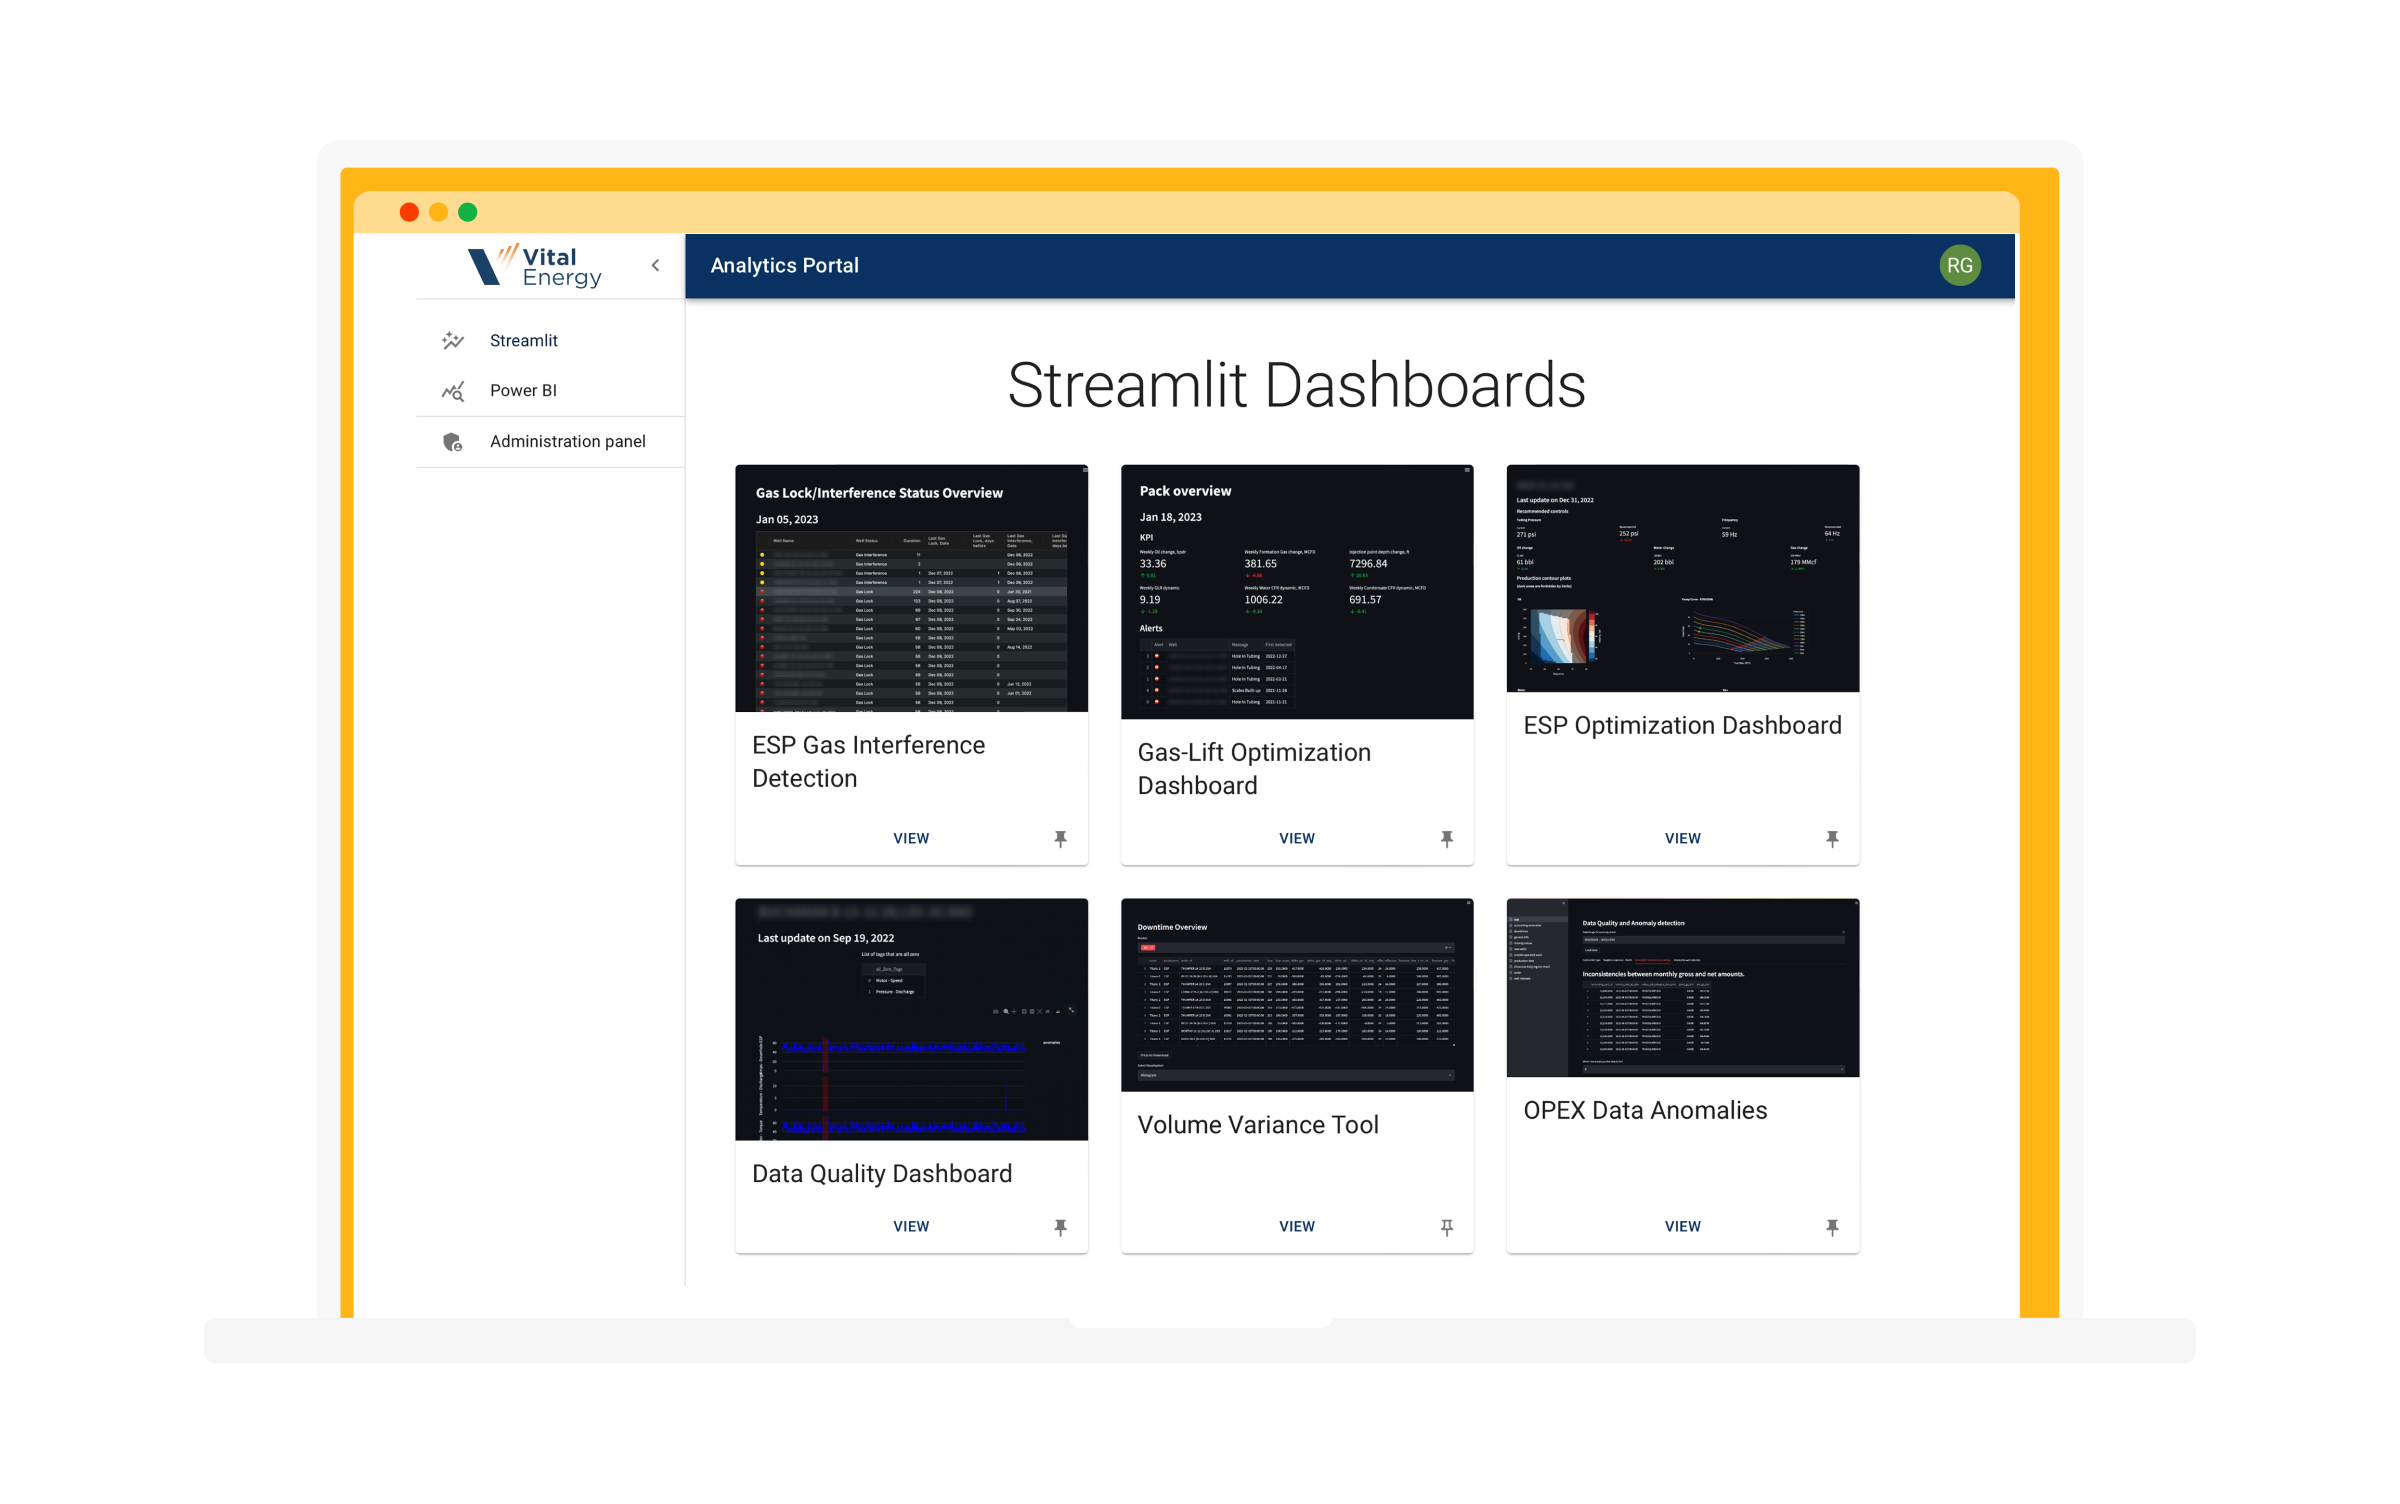
The SoftServe team helped develop two more dashboards:
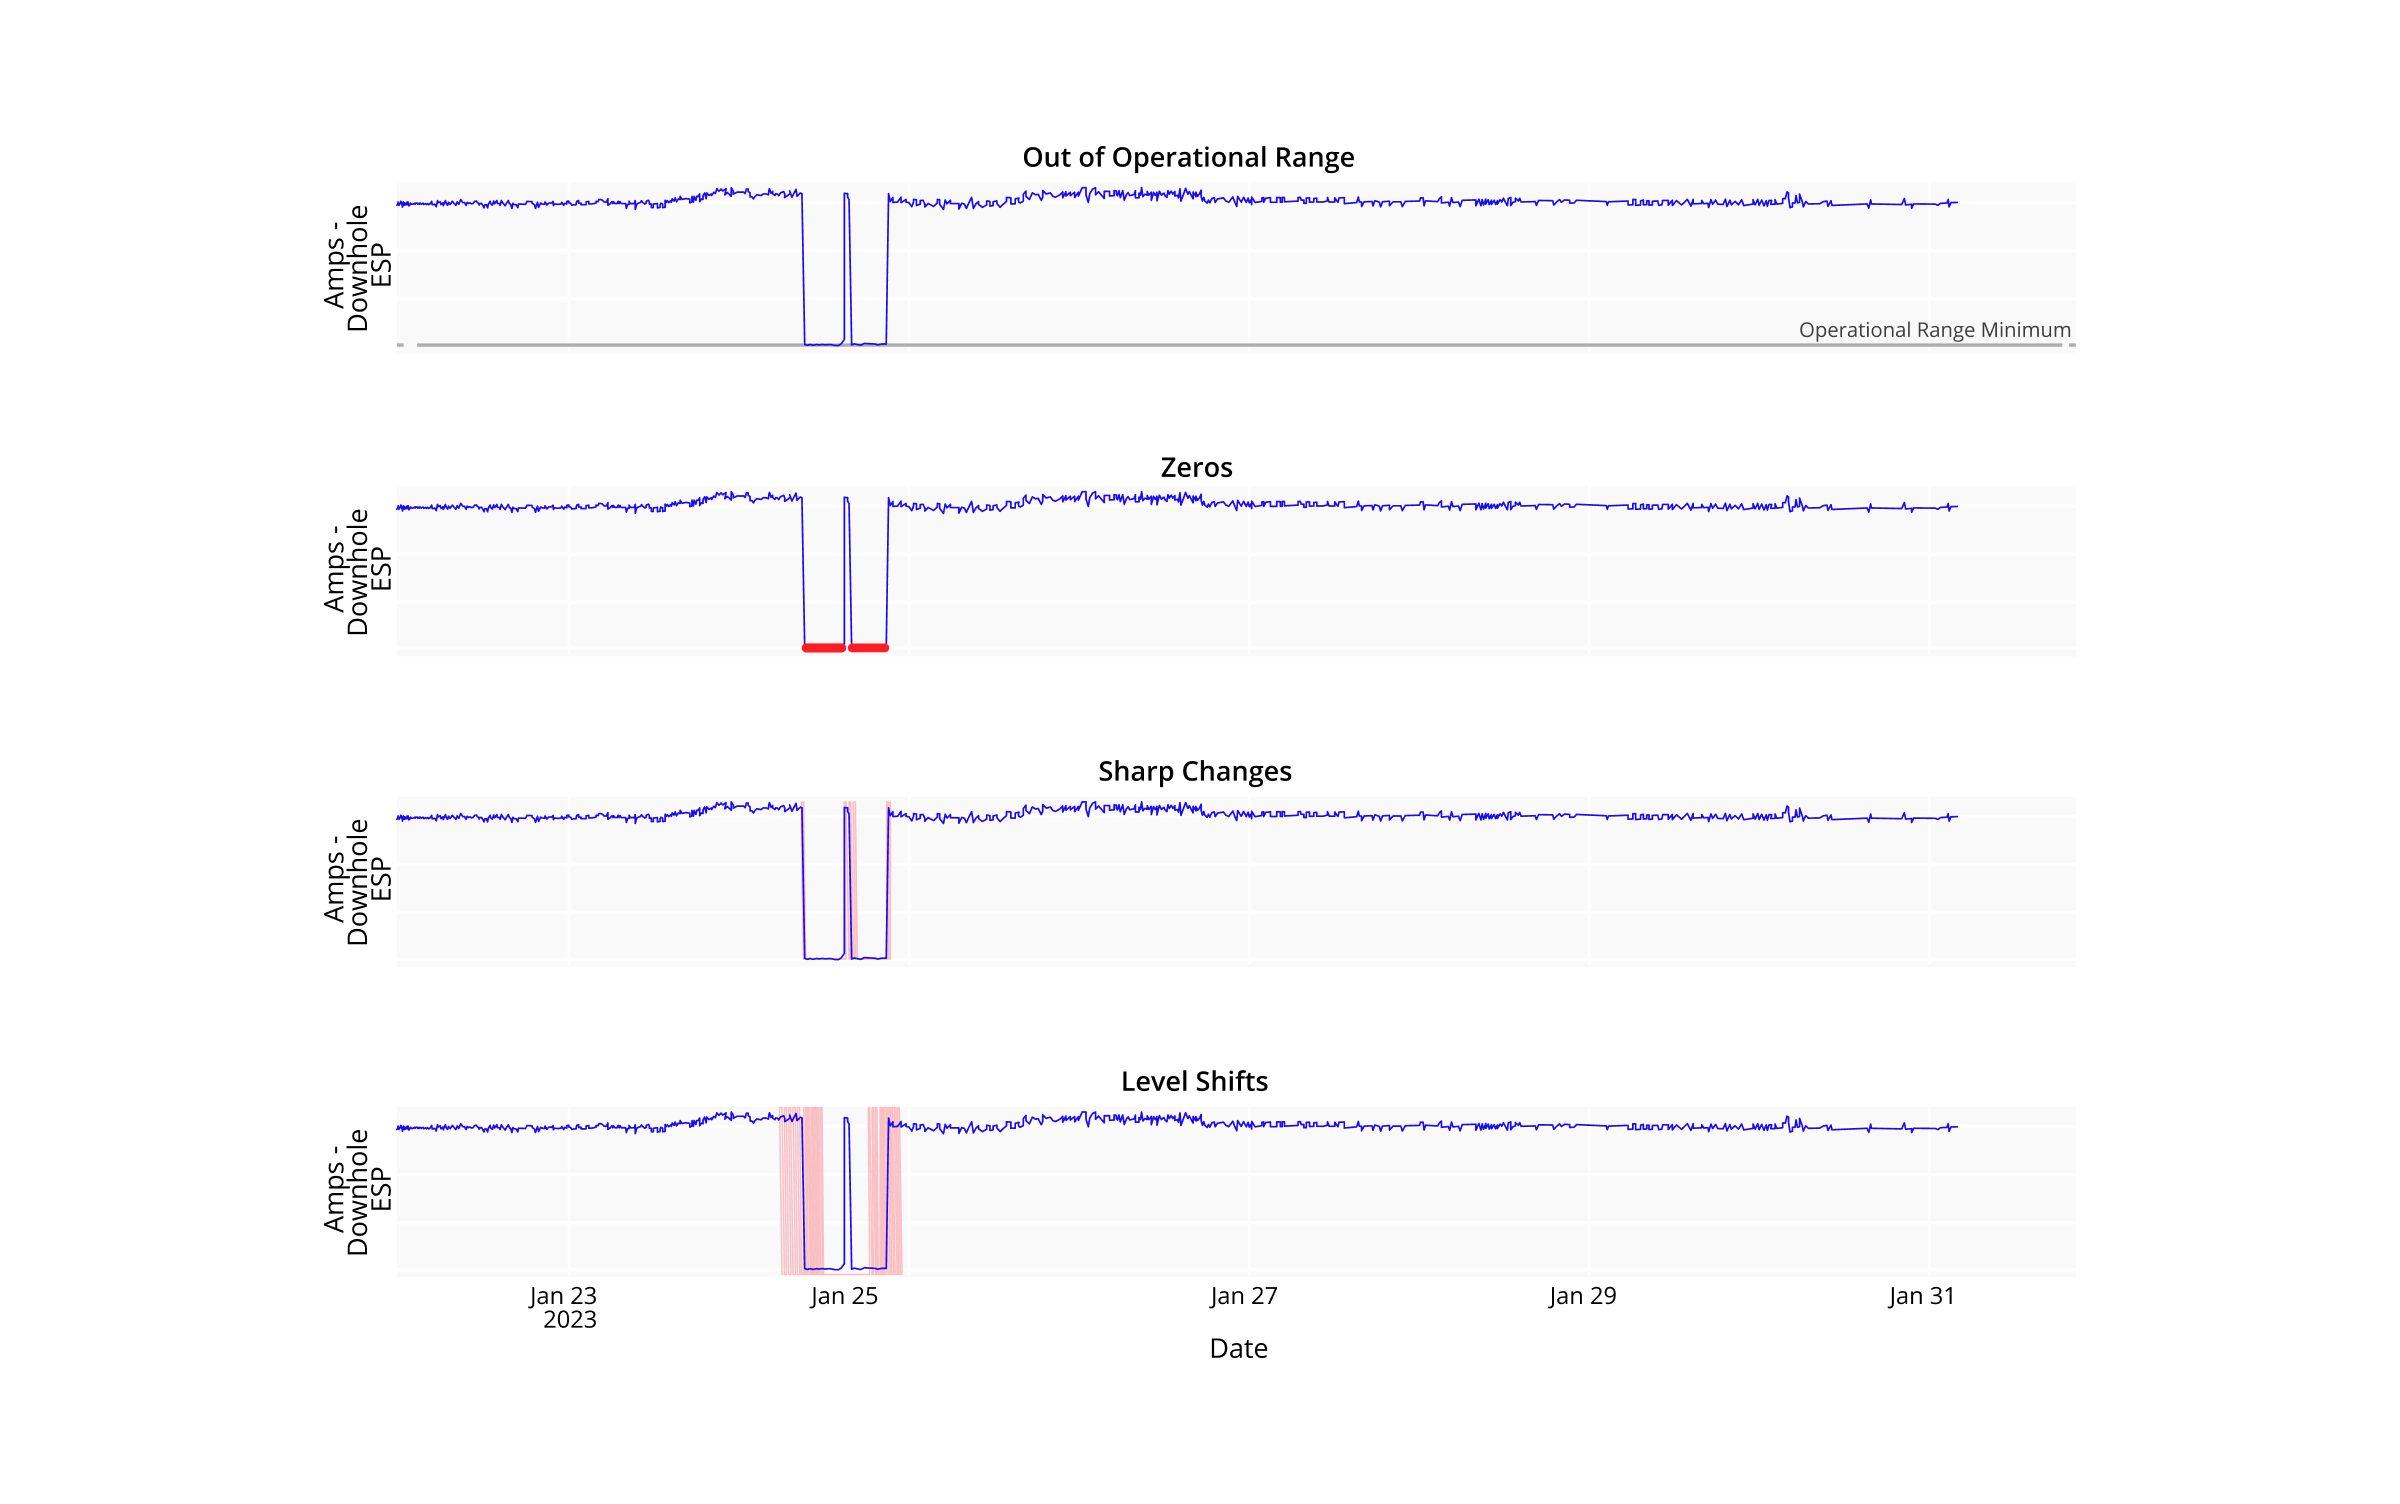
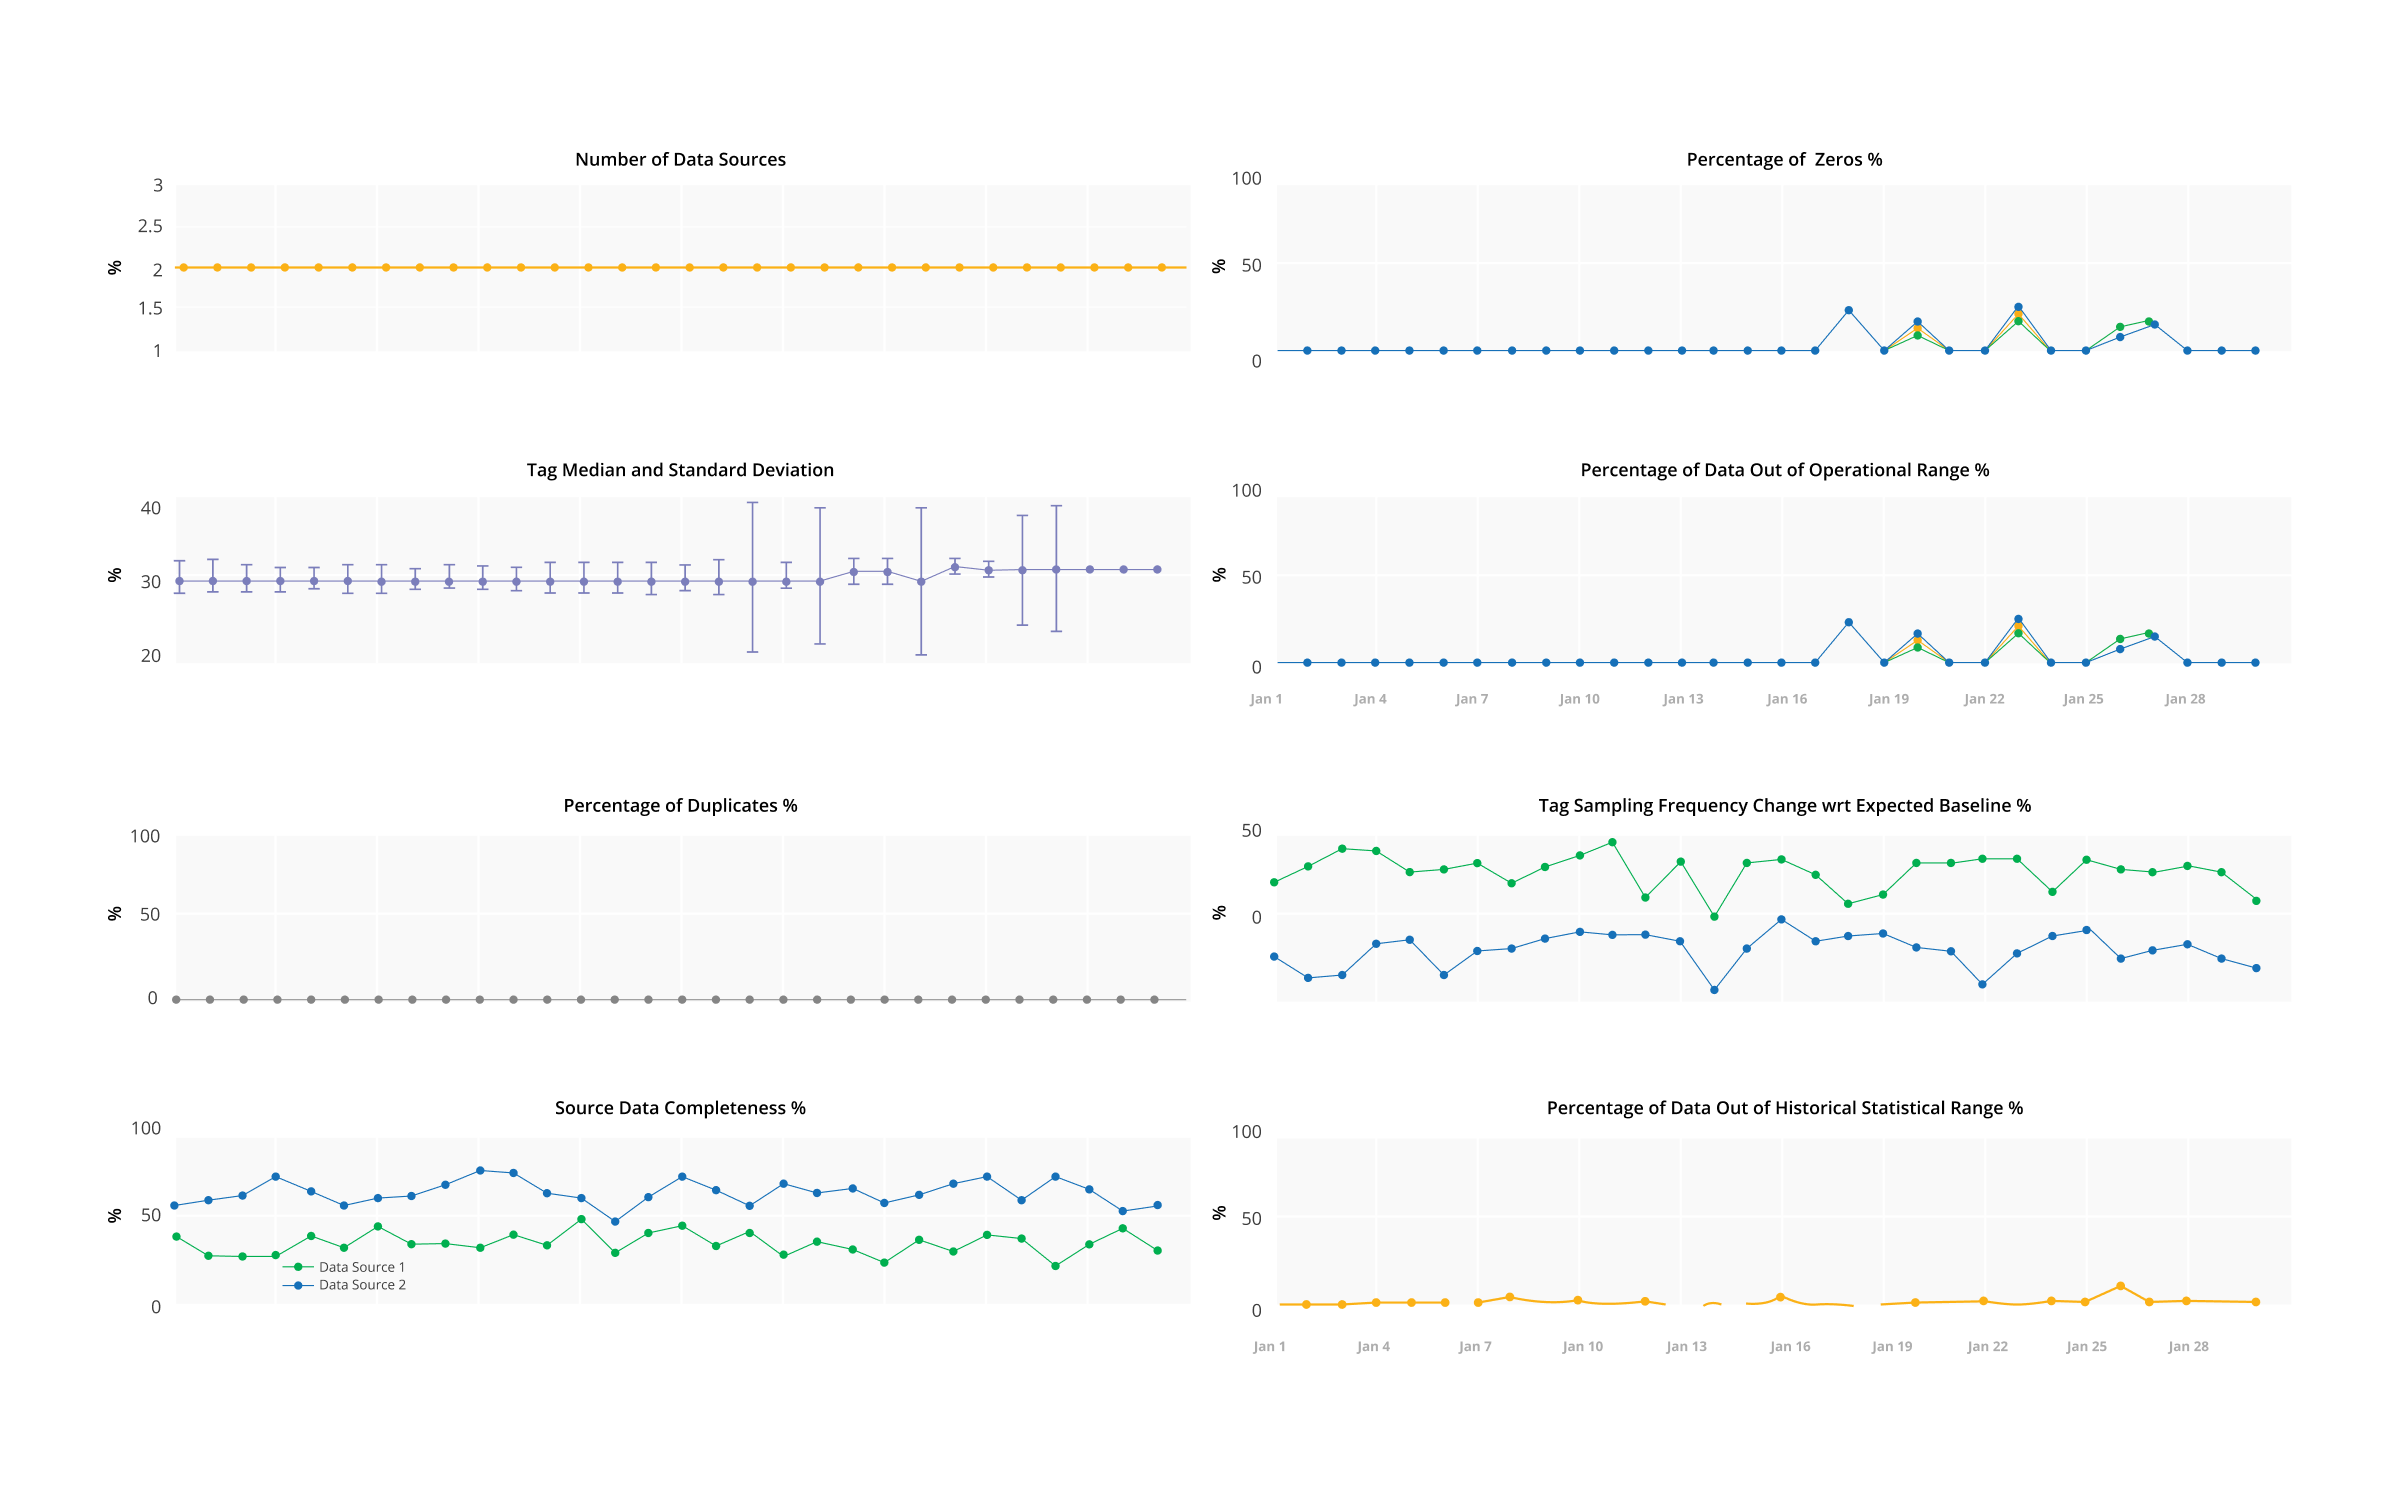
The Data Health Monitoring dashboard allows the client to monitor the data completeness and prioritize wells with the highest number of NAs or noise for further inspection. It classifies wells according to four different health categories (no data, high risk, medium risk, and normal) based on the average health statistics thresholds. Main data health statistics include but are not limited to:
- Number and percentage missing critical tags.
- List of available data sources and their associated completeness percentage.
- Percentage of tag value duplicates, zeros, out of operational and historical statistical ranges.
- Percentage of anomalies and relative completeness and data frequency changes.
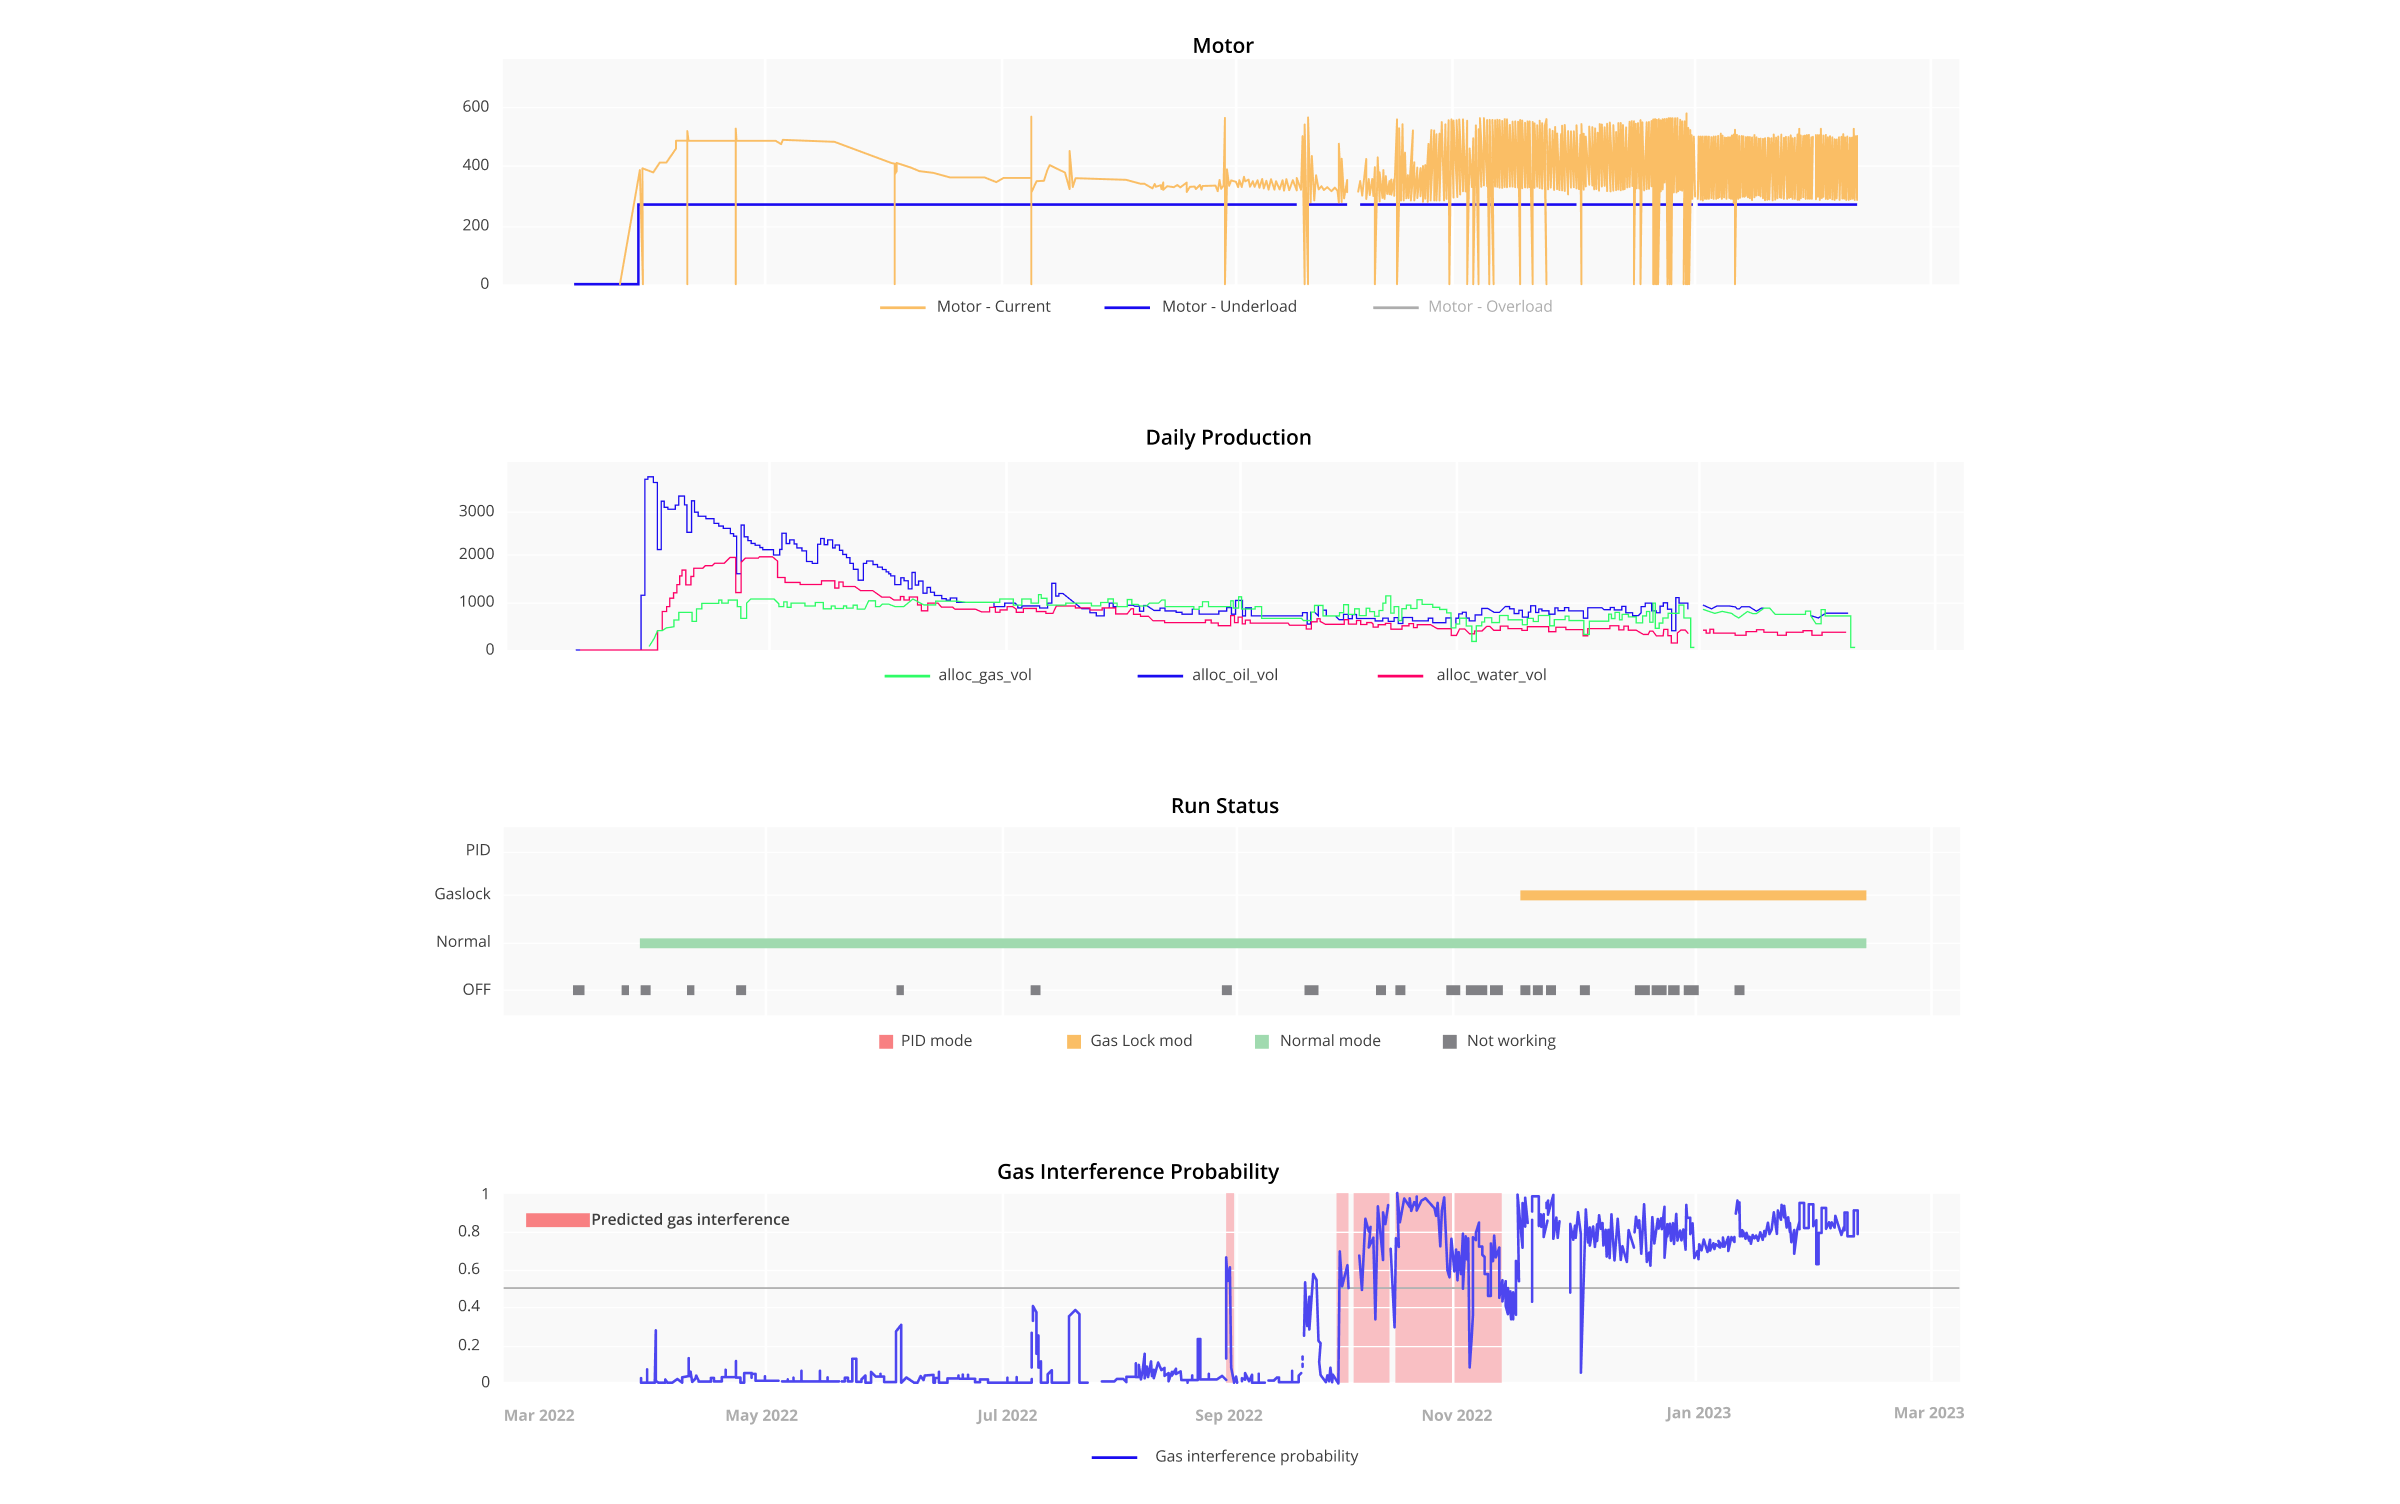
The Gas Interference Detection dashboard monitors wells and alarms about gas interference and gas lock events. It also enables the labeling of these and other events for further ML model re-training.
ESPs have gas lock and PID controllers that activate when there is too much gas in the system. Gas lock events lead to a reduction in oil production and faster equipment deterioration. The current gas inference detection algorithm provides operators with daily forecasts of gas interference events that provide early warning signs about potential gas locks.
The current pipeline provides real-time monitoring of ESP system data for ~80 wells, which contain enough telemetry for reliable predictions. The developed dashboard also allows users to label gas interference and any other anomalous events in the ESP operations history. The early detection of a potential gas lock allows operators to adjust the system to prevent or postpone PID or gas lock recovery modes from enabling. Preventing 20% of gas lock events ends up in an additional ~1000 days/year for ~80 wells working in the normal model. In total, avoiding gas lock for 1000 days would result in an additional 5 thousand barrels of oil.
Value delivered
SoftServe helped Vital Energy optimize operations and make the move to automated decision-making, resulting in increased oil and gas production. Algorithms provide operators with recommendations for optimal control settings and highly accurate predictions of oil, gas, and water production. Real-time dashboards provide summary statistics and forecasts for better decision-making.
The initial pilot on 29 wells achieved a production increase of ~400 BPD in the first month of implementing the solution. Later, the client was able to get 800 BPD from around 50 wells.
From March to August 2022, production increased by nearly 40,000 barrels compared to the corresponding period of 2021. During that period, the WTI oil price was, on average, $102/barrel, which resulted in approximately $4 million in gains.
Today, the solution provides real-time monitoring for more than 150 ESP systems.

LET’S TALK about how SoftServe can help you optimize your ESP lift systems to increase your production rates!
This project was completed in two complementary phases. Discover how we used AI to enhance ESP efficiency in the first phase here.